Data Driven UI
frontend architecture - 📁 experiments
The following is a summary of research I’ve made while attempting to build a web application where each views would be generated based on how to organize data and how to organize its visualization.
The idea of separating data from HTML markup isn’t new, there has been many attempts
It is a follow up about one of the many tweets where I’ve made allusion about the same idea.
I just came up with my shortest summary for leveraging Vue,React,Svelte; "X as a UI Runtime"
UI generated by code that's reading data, that's describing views embedded with metadata about what and how to get content for itself.
Thanks @dan_abramov for your article overreacted.io/react-as-a-ui-runtime
Source
The article from @dan_abramov, titled "React as a UI Runtime" and Generate Vue.js components from JSON DOM Structure.
At first, I experimented with this JSFiddle, then, I implemented a more complete solution allowing me to keep memory a dataset (i.e. fetch once) in a given shape, and plug in how to assemble (i.e. change shape on screen, without re-fetching). Leveraging Vue.js’ design.
Description
Most FrontEnd tutorials and literature explains how to manually stitch HTML or JSX (now with React) together to make a view.
In most examples they show how to display values from numbers or strings. As strings. But rarely ways of "dressing up" more than one properties together dynamically.
That is also true for more advanced "component library" where we might want to re-use the same application layout for completely separate products. Not all projects uses exactly the same stack.
1. Value components
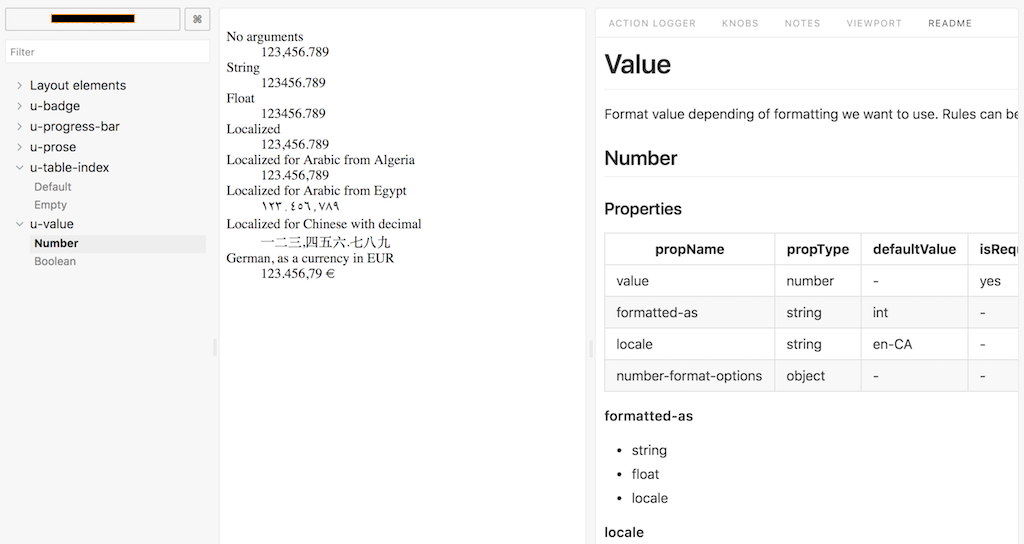
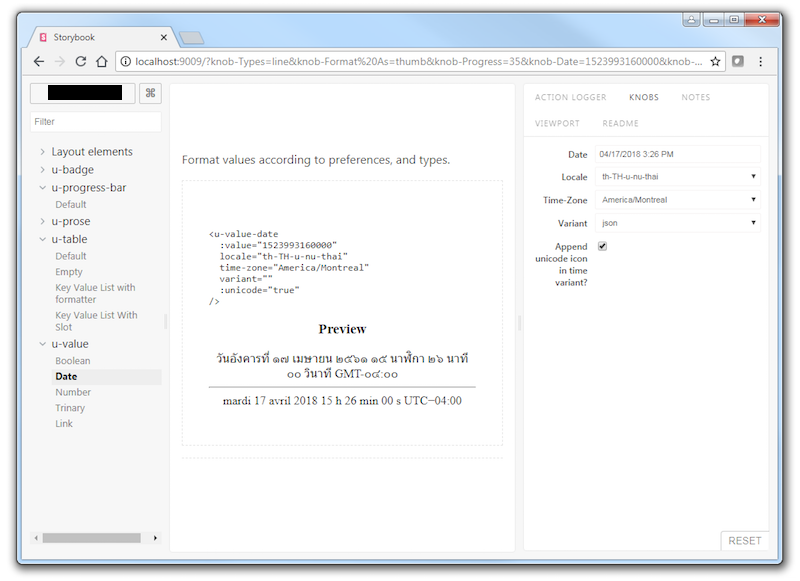
Components used to dress up complex values such as a circle with color. A date, where we plug in the user's locale and time zone, etc.
Here, shown inside an "UI-Value" project where we're publishing how to display a value.
We can use Storybook to work and visualize those components.
2. DisplayUnit and DataViewParent pattern
Which allows us to keep memory a dataset in a given shape, and plug in how to assemble.
Making views change completely by telling use this dataset (e.g. Vuex Store
module in foo/bar/baz in rows), and just flip which DisplayUnitCollection
to use and/or which top level DataView* component.
For example,
I want to put the contents of each rows’s content property inside a something value component.
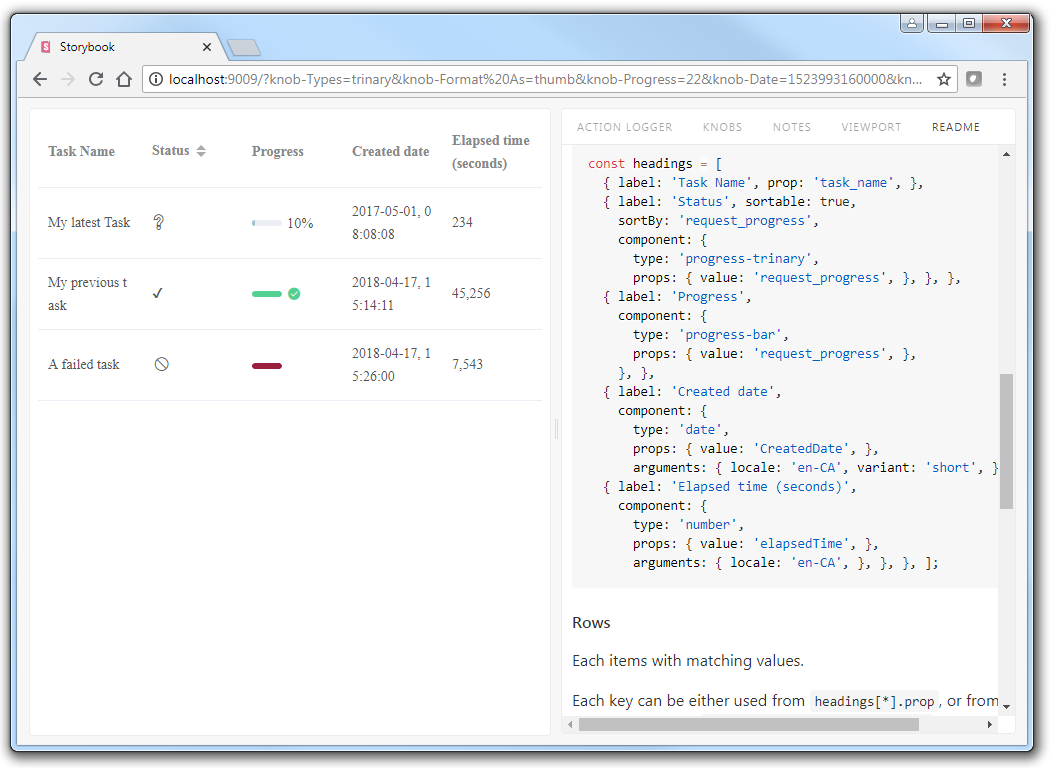
And we can use that idea to describe a view. Such as a table with data.
A DisplayUnit can be seen as a descriptor to tell properties we want and how to organize the data, and with which we can pass into a "DataViewParent".
- The first column to use the each rows’s "`task_description`" property as
  value, and use "Task" as a label on top of the column
- The 2nd column to be labelled "Status", that is sortable, sorted by the value
  of "`completionProgress`" property, for each row cell, I want a
  "progress-trinary" component.
- The last column would be the date and time of the event in the current user's
  locale and time zone
headings:
  - label: 'task.label'
    prop: task_description
    component:
      type: router-link
      params:
        route: task-id-detail
      props:
        id: id
  - label: 'task.status'
    sortable: true
    sortBy: completionProgress
    component:
      type: progress-trinary
      props:
        value: completionProgress
  - label: 'task.completionState'
    component:
      type: progress-bar
      props:
        value: completionProgress
  - label: 'date.createdAt'
    component:
      type: date
      props:
        value: CreatedAt
With the description of the view, we can then pass some context and data and get a listing view.
rows:
  - completionProgress: 78
    task_description: Sending notification
    CreatedAt: 1580798072
    id: abc-123
    targetMachine: aaa-bbb-ccc
  - completionProgress: 100
    task_description: Updating dependencies
    CreatedAt: 1580794472
    id: abc-456
    targetMachine: ddd-eee-fff
    status: 1
session:
  locale: en-CA
  timeZone: America/Montreal
i18n:
  messages:
    en:
      task:
        label: Task
        completionState: Progress
        status: Status
      date:
        createdAt: Creation Date
DataViewParent
The "DataViewParent" are basically different ways of "dressing up" views.
One "DataViewParent" could be for listing a collection of objects, and another would be to display detail of only one entry.
List of all entries
In the example above, we could tell to list all entries as a table where we know the name and label for each columns, and how to format each rows.
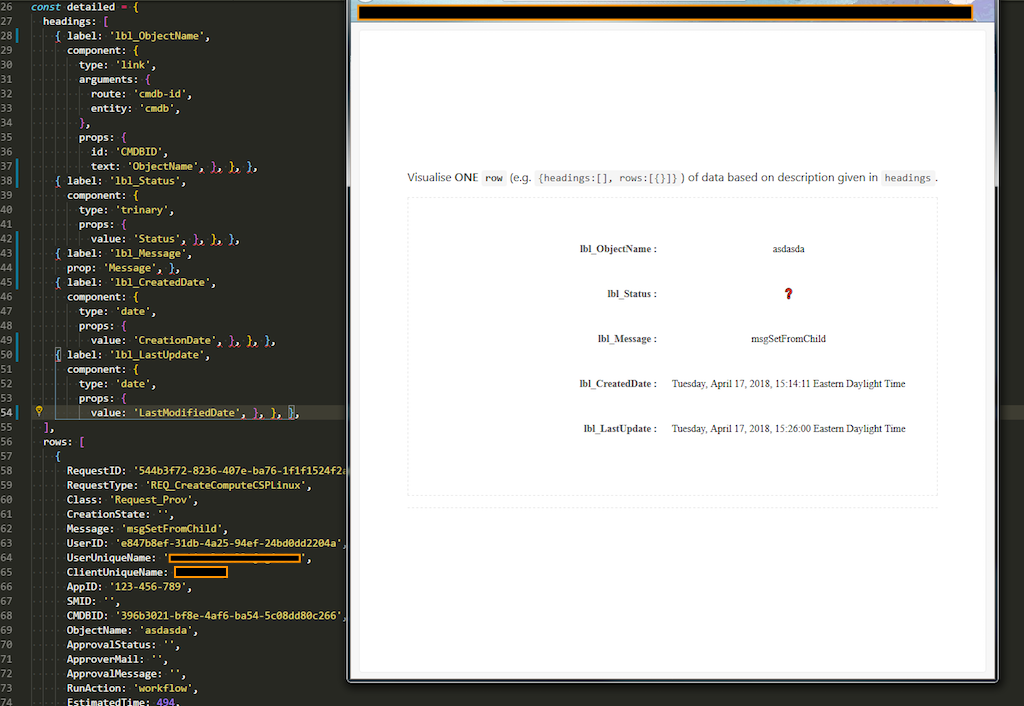
And using the same pattern, we could describe a more detailed view for one of the currently selected item.
| Task | Status | Progress | Creation Date |
|---|---|---|---|
| Sending notification | ⏳ | Tue Feb 04 2020 at 01:34 | |
| Updating dependencies | ✅ | Tue Feb 04 2020 at 00:34 |
Detail of one entry
Imagine the rows are the same as the example above, but where we want to display each properties on a table where the label is on the left, and the value on the right.
| Label | Property value |
|---|---|
| Task | Sending notification |
| Status | ⏳ |
| Progress | |
| Creation Date | 2020-02-04 |
So, we can use the same data, and change how to display that data independently.
With this system in place, we could setup a completely different way of visualizing with the same data.


